EMME/2 provides a powerful environment for any kind of network computations. While the assignment modules are used to forecast the future use of the transportation infrastructure in terms of traffic volumes and speeds, the network calculator, module 2.41, can be used to postprocess the assignment results, computing whatever data that needs to be derived from the basic assignment results by simply entering the corresponding formulae. Typical examples of such postprocessing are the computation of level of service categories, emission of pollutants, noise levels or fuel and energy consumption. These computations are usually performed at the link level and the results are either summed or stored in link attributes for future use and graphic display on network plots.
In many situations, however, the aim of such models is not to obtain results at the network level, but the results are needed according to a different spatial aggregation, e.g. at the level of the traffic zones or aggregated according to a grid subdivision, which cuts the area into rectangular cells of identical size. These kinds of aggregations cannot be implemented easily within the framework of the network calculator, in particular if one network link can cover more than one aggregation cell. Hence, more specialized tools are needed for this purpose.
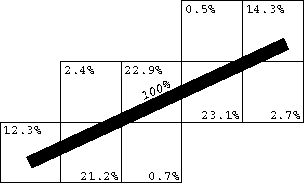
GRTOOL is a general link-to-grid interface which can be used to convert any link based network data into a grid array with arbitrary cell dimensions. Each link based quantity is split proportionally to the overlap with the corresponding grid cells, and then accumulated at the grid cell level. In order to avoid ambiguities that might arise when a link coincides with a cell boundary, a width is associated with each link and the link is split according to the overlapping surfaces, as shown in the illustration below:

GRTOOL consists of the following components:
grmacro) and outputs
a grid based result file, which contains the same variables as the link
file, but accumulated for each grid cell.
grlink, extracts one value for each grid cell from it
and generates
an annotation file which can be displayed in EMME/2, either alone or
superimposed on a network plot. The type of display is controlled by
a parameter file which is generated with the grparam utility.
grannot
for producing displays of this particular kind.
A typical application of GRTOOL is in the area of environmental impact studies,
where often the emissions of the various transportation related pollutants
(such as CO, HC, NOx, Pb, SO2) have to be computed at the link level,
and afterwards are converted to the grid level. These may then be combined with the
pollutants generated by the stationary sources (industry, heating) in order
to display them as emission maps. In this case, the network calculator
is first used to compute extra link attributes containing the emissions
for all five pollutants. Then grmacro is used to generate a
link file with all five pollutant emissions. This file is
converted into a grid cell file by grlink, which can then be
accessed by grannot to produce plots of the individual pollutants or
combinations thereof. The graphic representations can be in the form
of differently colored and hatched interval classes, as proportional
squares, or as numeric values displayed in the grid cells.
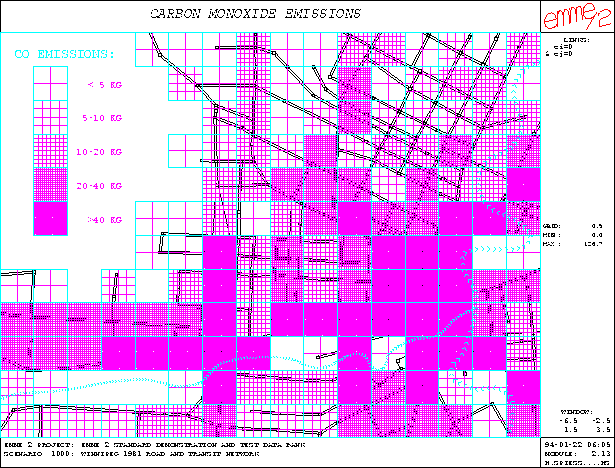
The example below shows the varying levels of CO emissions,
displayed as squares with different hatchings:

GRTOOL has been developed at the EMME/2 Support Center by Lukas and Heinz Spiess. DOS and UNIX versions of GRTOOL are made available to EMME/2 users upon request, at no charge, as a ``copylefted'' user contribution. Thus, GRTOOL is not part of the commercial EMME/2 software distribution and therefore its availability implies no obligations on the part of INRO Consultants.